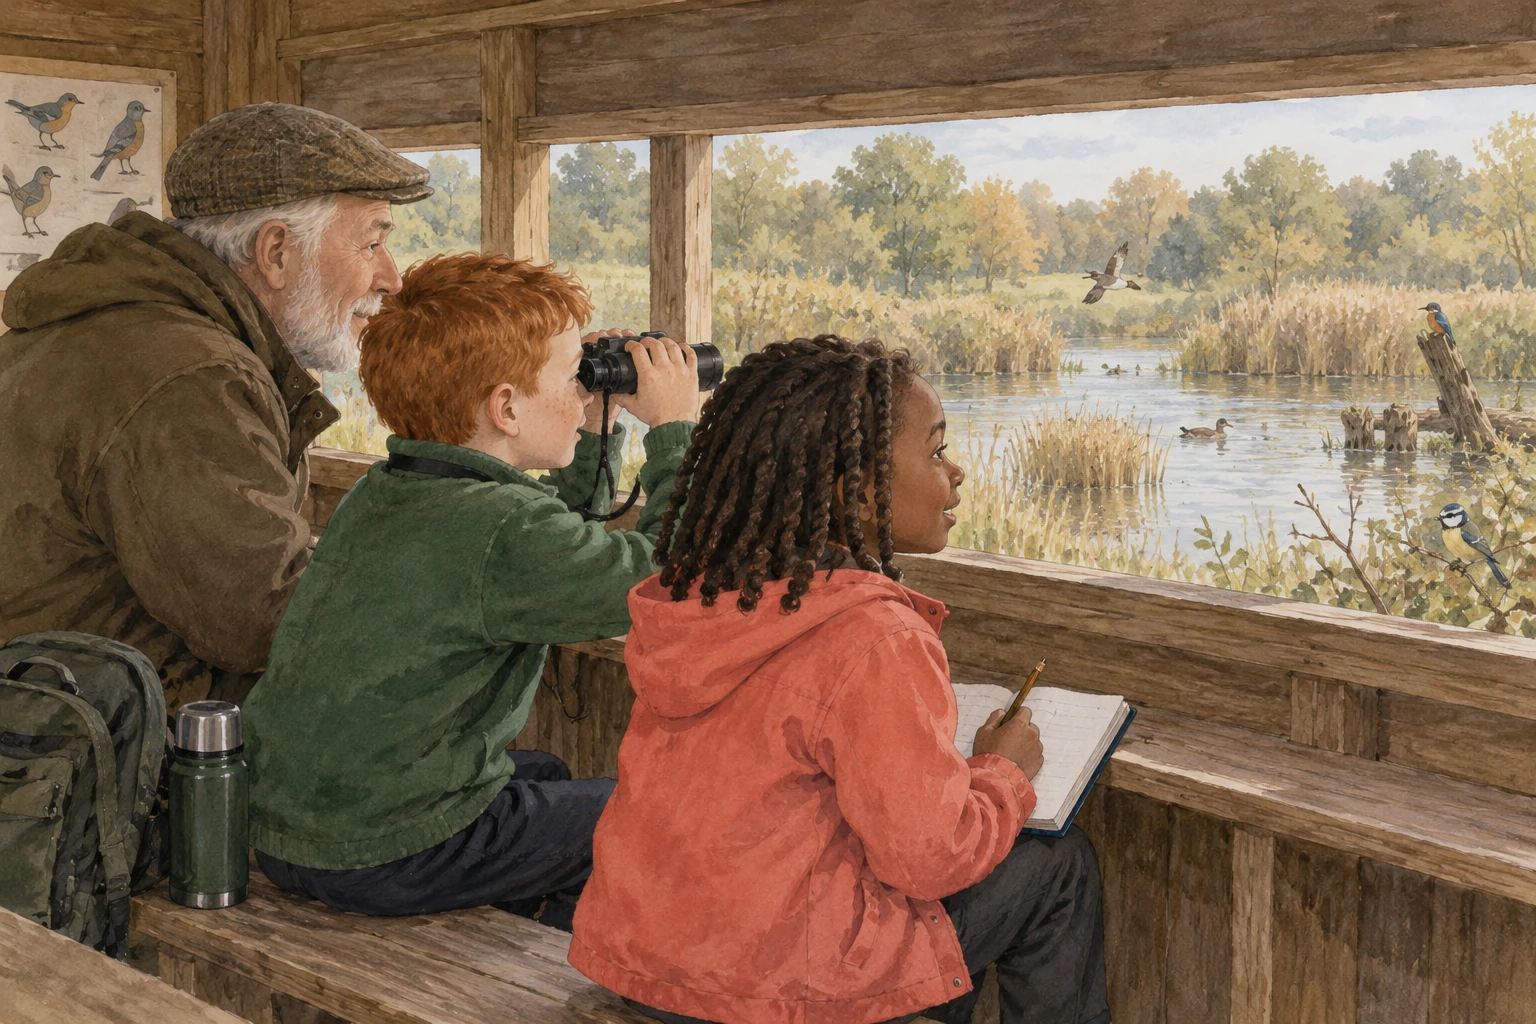
Stanley’s Bird Count
Shared Reading Books · Numeracy · Year 4Stanley and Rachel joined Grandad for a bird count at the park. They watched from a quiet shelter and kept a record of the birds they saw during their chosen time. At the end, their totals were fifteen sparrows, ten starlings and five blackbirds.
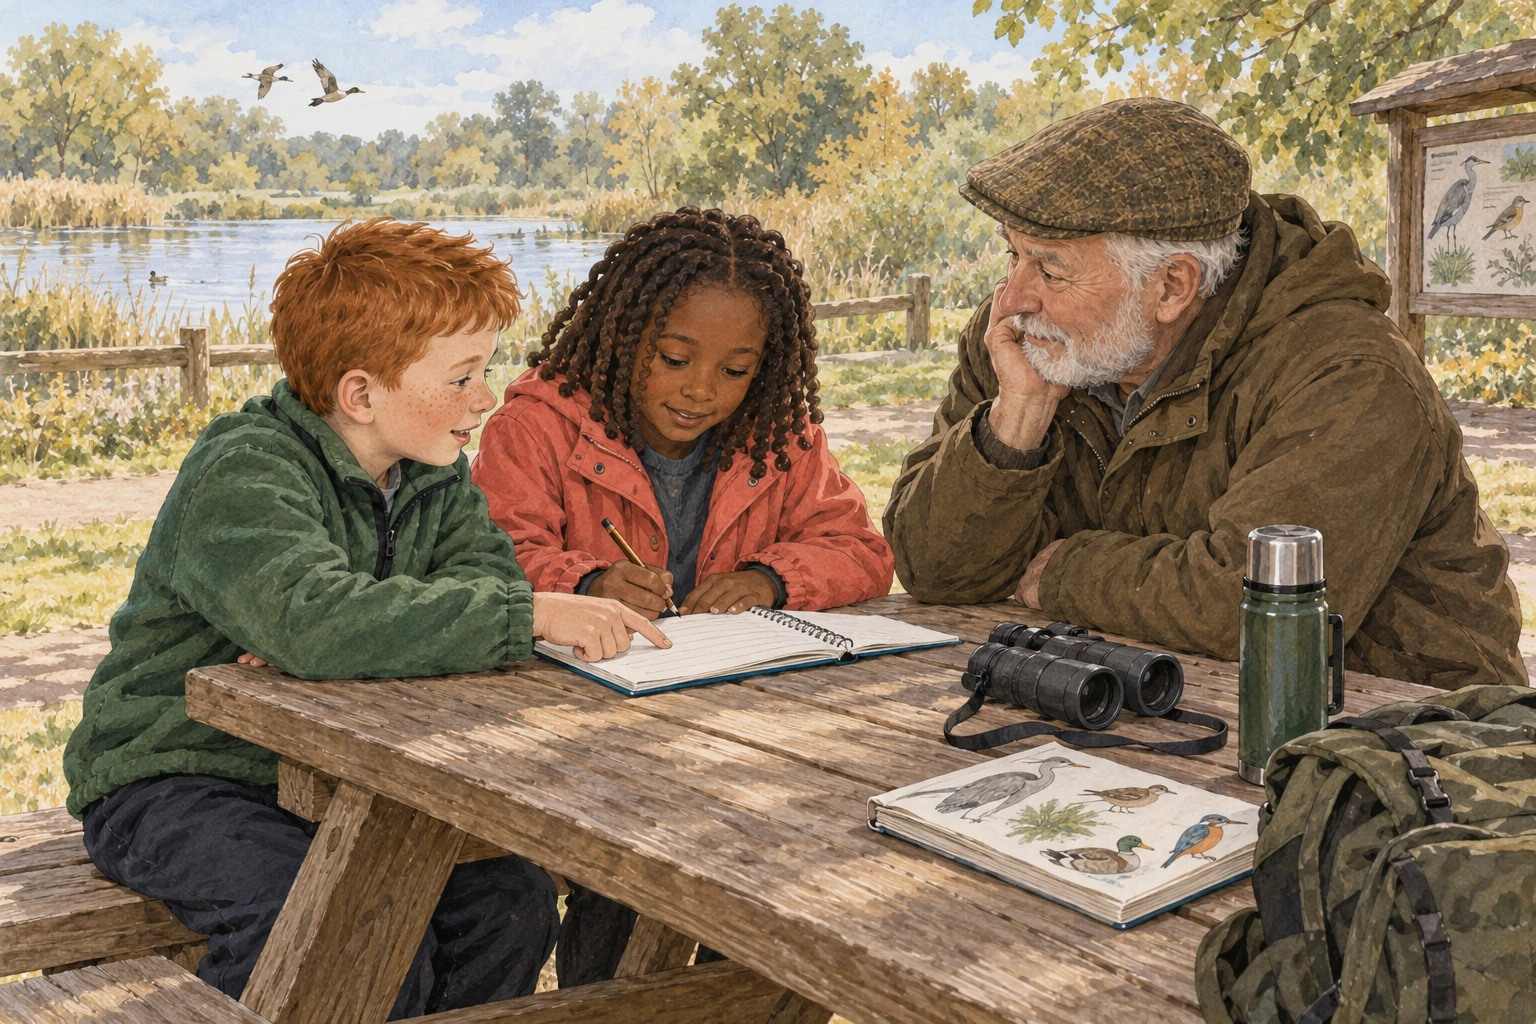
Back at the picnic table, Stanley wanted to make a chart. Drawing one square for every bird would need thirty squares. Rachel suggested using one square for five birds instead. “We can still show the totals,” she said, “but the chart will be smaller.”

They wrote a key to explain the scale: one square represented five birds. Stanley made a sparrow bar with three squares. Three groups of five made fifteen. Rachel checked the record before he moved on. The key mattered, because three squares did not mean only three birds.

The starling bar needed two squares, since two fives made ten. The blackbird bar needed one square for five. They began all the bars from the same starting line. Grandad asked why. “Then the lengths can be compared fairly,” Stanley explained.
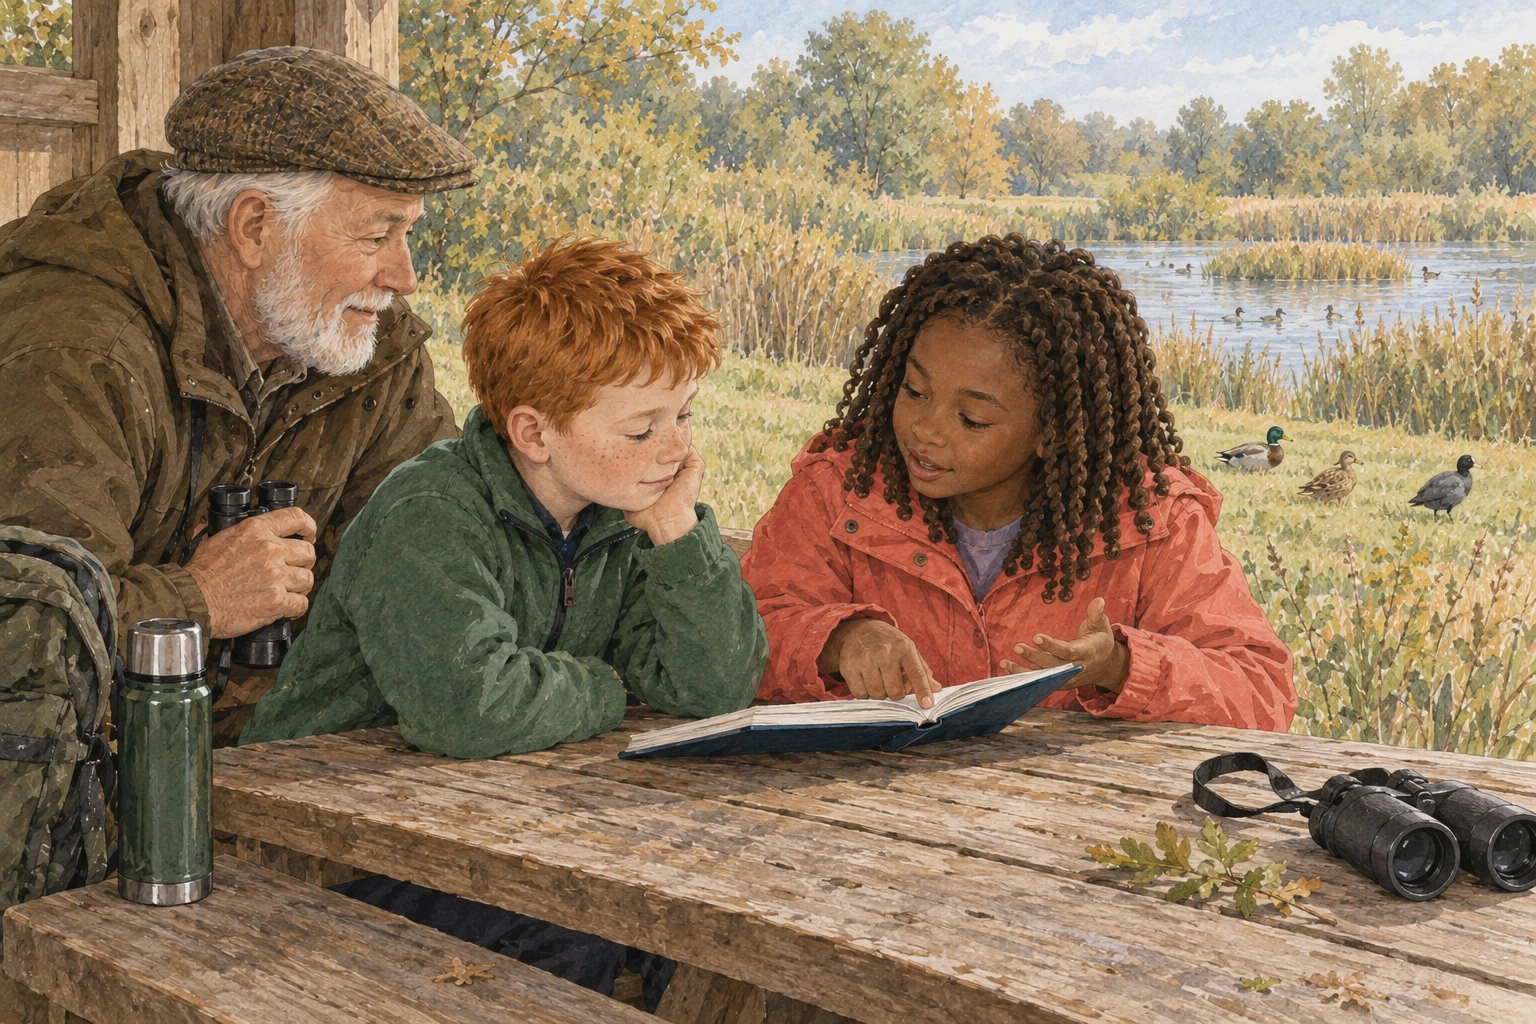
Rachel compared the sparrows with the starlings. The difference was one square, which meant five birds. Sparrows were the most common in their record. The blackbird total was five, so fifteen sparrows meant three times as many sparrows as blackbirds.

A breeze lifted the corner of their paper. Stanley held it down while Grandad found a clipboard. Rachel checked the total once more. Fifteen plus ten plus five made thirty birds. The six squares on the chart also stood for thirty, because each square represented five.
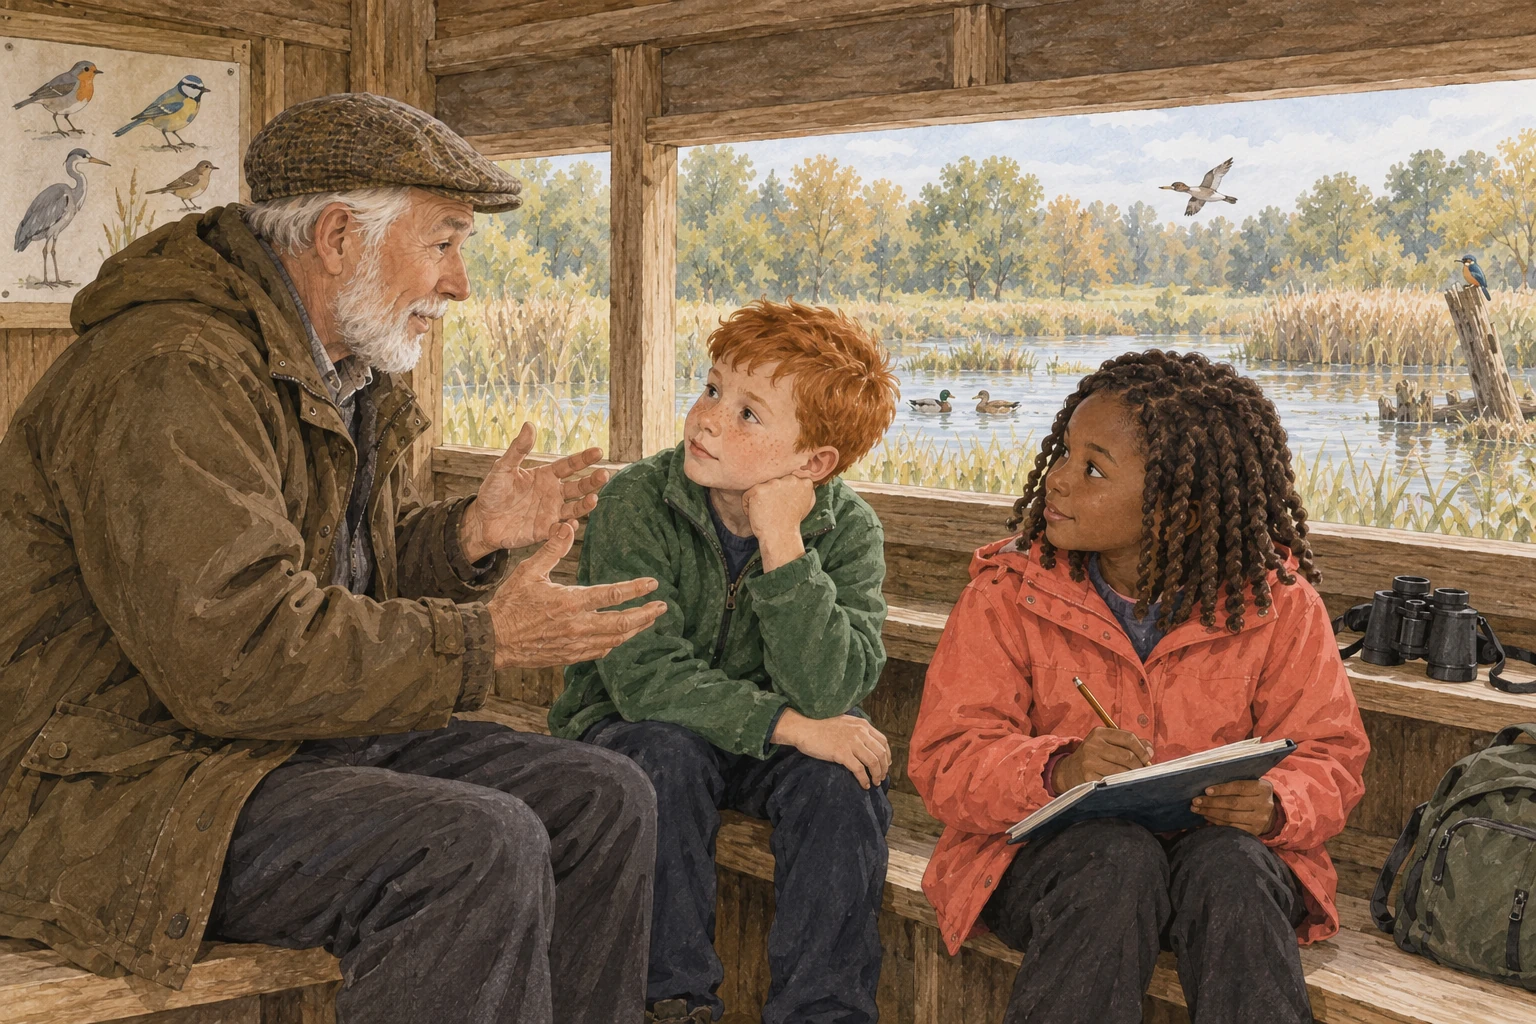
Before they left, Grandad asked whether the chart showed every bird in the park. Stanley shook his head. It showed the birds in their count, during the time they had watched. Another group, on another day, might record different numbers. Rachel added the date beside their key.
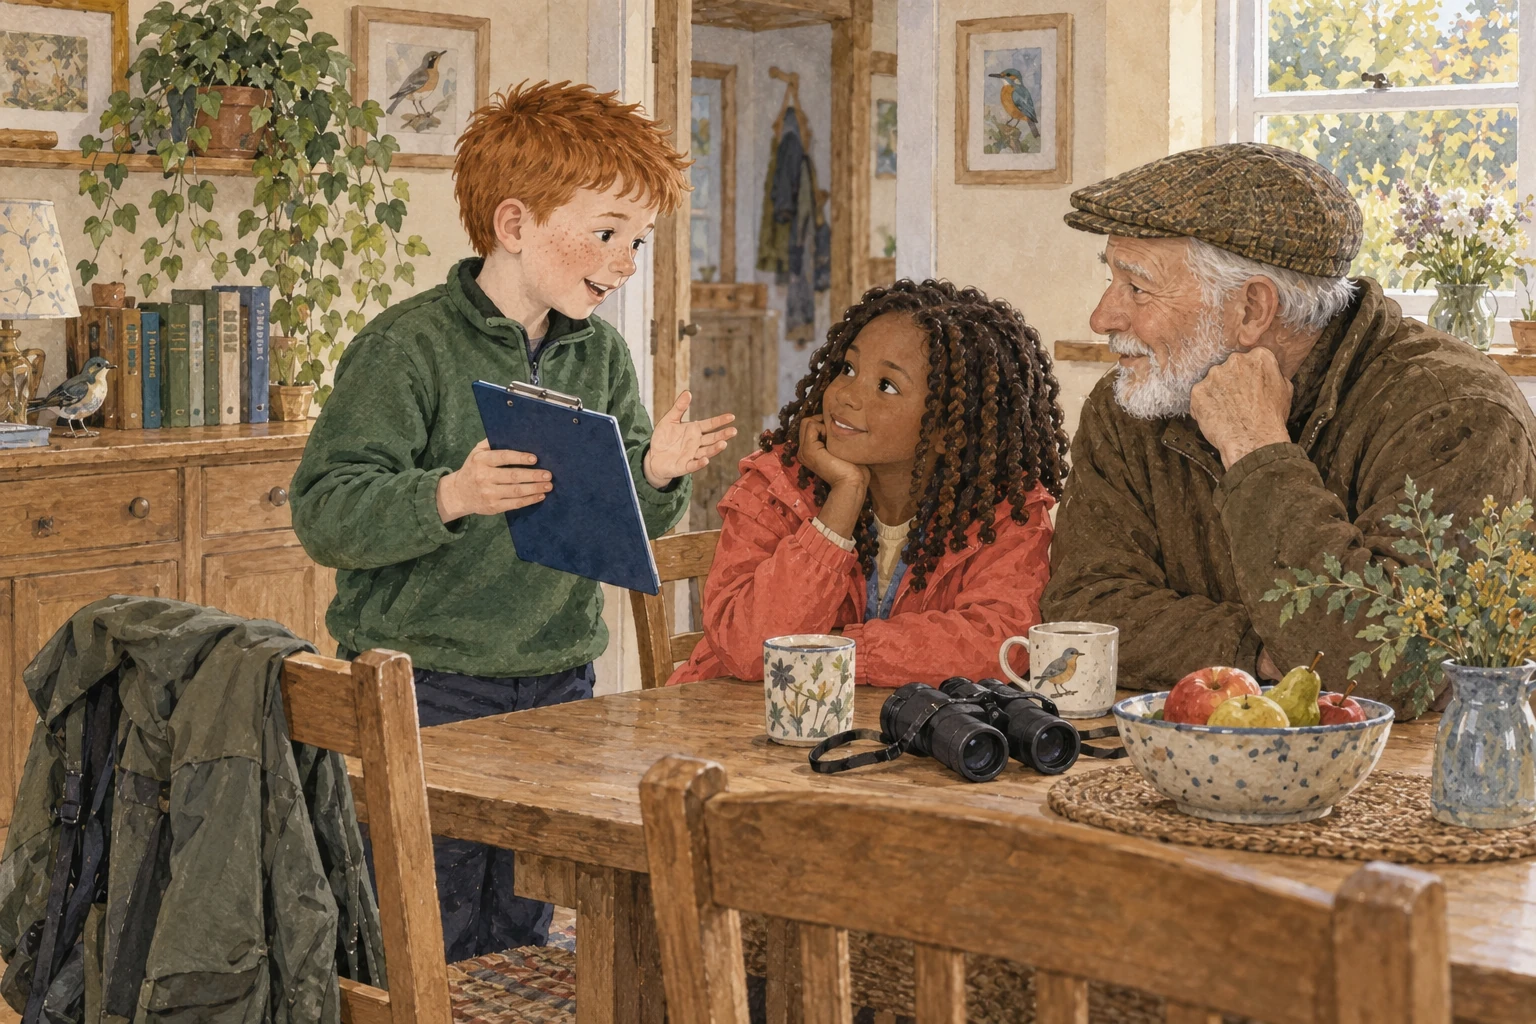
Stanley took the chart home in the clipboard. He showed his family the key before explaining the bars. “Count in fives, not ones,” he said. Rachel had been right: their smaller chart still told the whole story, as long as everyone knew what each square meant.